
*Companion piece to the video. By Ievgen Kovalevskyi, Google Ads specialist since 2009.*
You open your ad account and see a beautiful number: $2 leads. You smile. Then you open the cash register — and it's empty. No deals, no revenue. Sound familiar?
I have two pieces of news for you. The bad one: $2 per lead is almost certainly not a victory — it's a diagnosis. The good one: your ad account isn't lying. It shows exactly what you asked it to show. What lies is the "lead = money" equation in a business owner's head. And today we'll break down exactly where it falls apart: seven places, three prices of a single lead, real cases with numbers, and a 7-day diagnostic plan.
---
The main idea: Google Ads doesn't lie. It follows orders
Remember this as an axiom: the Google Ads algorithm does exactly what it's told. Told to "find the cheapest lead" — it finds the cheapest lead. Nobody told it what a sale looks like.
The American agency ScaledOn managed a window and door manufacturer in the US. Performance Max delivered leads at $599 — 26% cheaper than search ($809). Everything looked great in the account. But the cash register was empty: many leads came from regions outside the service area, few booked a measurer visit, and closed deals were smaller than from search.
The reason fits in one sentence from the case: *the campaigns did exactly what they were told — find the cheapest lead. Nobody told them what a sale looks like.*
When the agency connected the CRM to Google Ads and started importing what happens after the lead — booked appointments, closed deals, real revenue — Performance Max ROAS grew from 1.05x to 3.08x in 30 days. Same campaigns. Same budget. The algorithm was simply finally told what money is.
Bottom line: your ad account doesn't lie. It honestly shows the cost per lead. The problem is that the cost per lead is not the cost of money.
---
$2 per lead is a red flag, not a victory
Let's be honest about where the "$2" in the headline comes from. It's a marketing hook — a familiar paradox you've probably seen in your own accounts: penny leads and an empty cash register.
Now the facts. WordStream by LocaliQ's 2026 report (13,474 campaigns, April 2025 to March 2026) recorded an average Google search cost per lead of $66.69. A year earlier it was $70.11. The first decline in five years — but you can see the order of magnitude.
And by vertical:
| Vertical | Average cost per lead (CPL) |
|---|---|
| Lawyers | $131.63 |
| Real estate | $102.51 |
| Business services | $93.69 |
| Search average | $66.69 |
| Search average, 2025 | $70.11 |
*Source: WordStream by LocaliQ, 2025 and 2026 reports.*
If in a competitive vertical the average lead costs $66–130 and yours costs $2, you're buying the wrong people. A lead priced tens of times below the market is almost always junk traffic: queries with no buying intent, spam, accidental clicks. $2 per lead is a red flag. Like a body temperature of 95°F: seemingly "below normal," but you wouldn't call it healthy.
Exceptions exist — a hyper-niche product, branded traffic, a perfect offer. But the rule is simple: the cheaper a lead is relative to the market, the harder you should look at who these people are and what they want.
---
The math of the gap: one lead has three prices
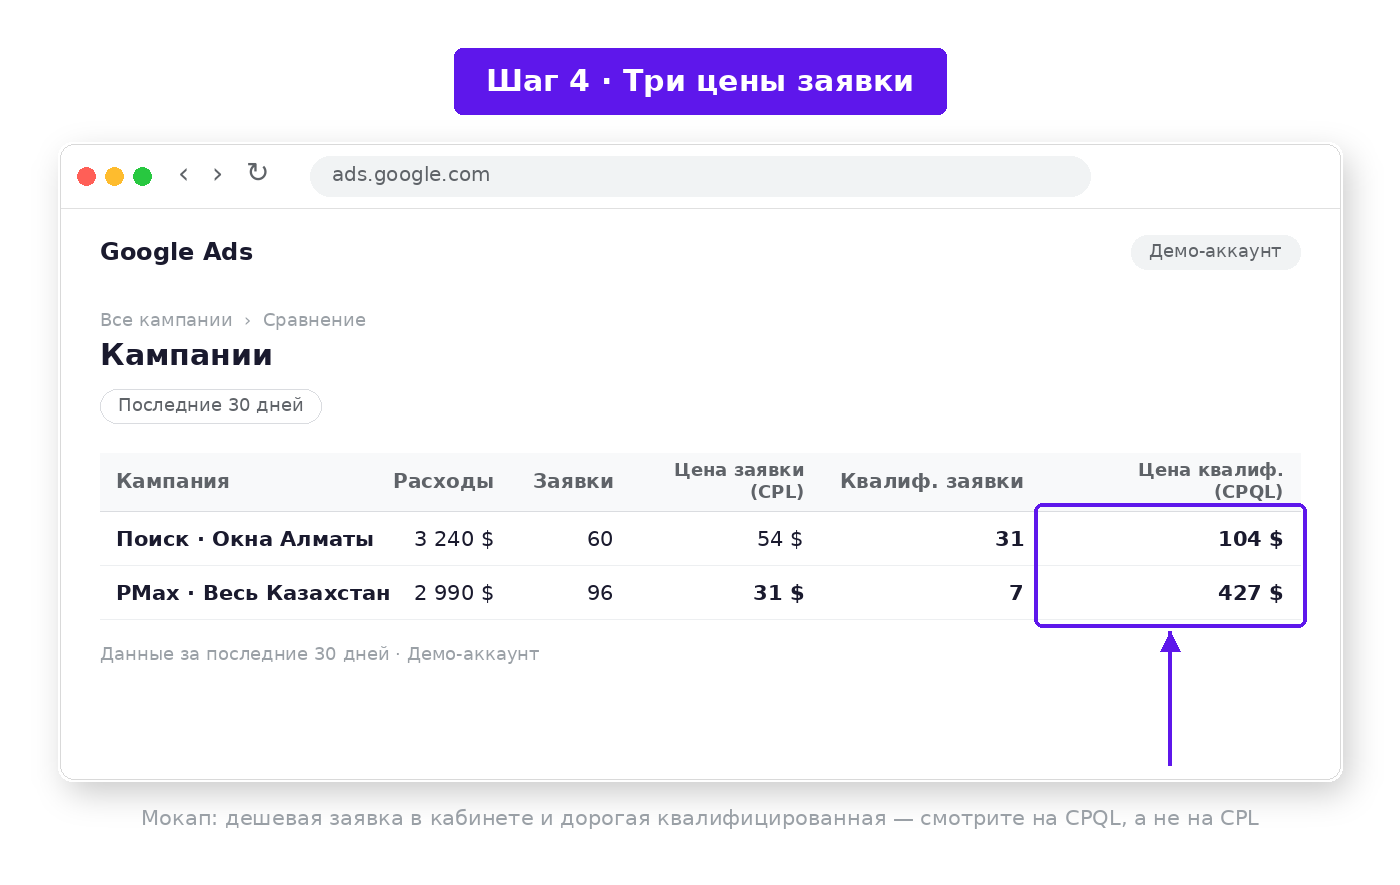
Here is the main tool of this article. Every lead has three prices, and the ad account shows only the first:
- CPL (cost per lead) = ad spend / all leads. That's the number from the account.
- CPQL (cost per qualified lead) = ad spend / qualified leads. That's the number from the CRM.
- CPS (cost per sale) = ad spend / closed deals. That's the number from the cash register.
The gap between them is the answer to "where does it lie." Look at the real cases:
| Case | CPL (account) | CPQL | Cost per deal / opportunity |
|---|---|---|---|
| B2B services, $42,000/year average ticket | $96 | $873 (sales-accepted lead) | $6,940 (opportunity) |
| Business financial services | $120–140 | over $1,200 | — |
| IT services, Karachi | "conversions" kept flowing | 4,200 → 2,898 rupees (after cleanup) | lead-to-sale conversion 12% → 21% |
| Local business, 200 leads/month | $25 | — | ~$208 before (12% close rate); revenue x2 after |
| Windows and doors, USA (PMax) | $599 | — | ROAS 1.05x → 3.08x after offline conversion import |
*Dash — no data in the public case. Sources are in the "Sources" section.*
Stop at the first row. A B2B company with a $42,000 average annual ticket and a 45–120 day sales cycle spent $38,500 a month and saw a $96 cost per lead in the account. Great, right? But in the funnel: only 11% of leads were accepted by the sales team. The cost of a sales-accepted lead was $873. The cost of one opportunity was $6,940. Management thought the problem was the sales department. The sales department thought it was marketing. In reality, Google Ads was bringing the wrong people, and the tracking encouraged it.
Write down these full-funnel formulas and pin them above your desk:
- CPL = spend / all leads
- CPQL = spend / qualified leads
- CPO = spend / created opportunities
- CPS = spend / closed deals
If you only count the first one, you're managing your ads blind.
---
Seven places where money gets lost
Below are the seven gaps between a lead and the cash register. For each: how to spot it in 5 minutes in your account, and what to do. Summary table at the end of the section.
1. Broad match keywords: you're paying for "free"
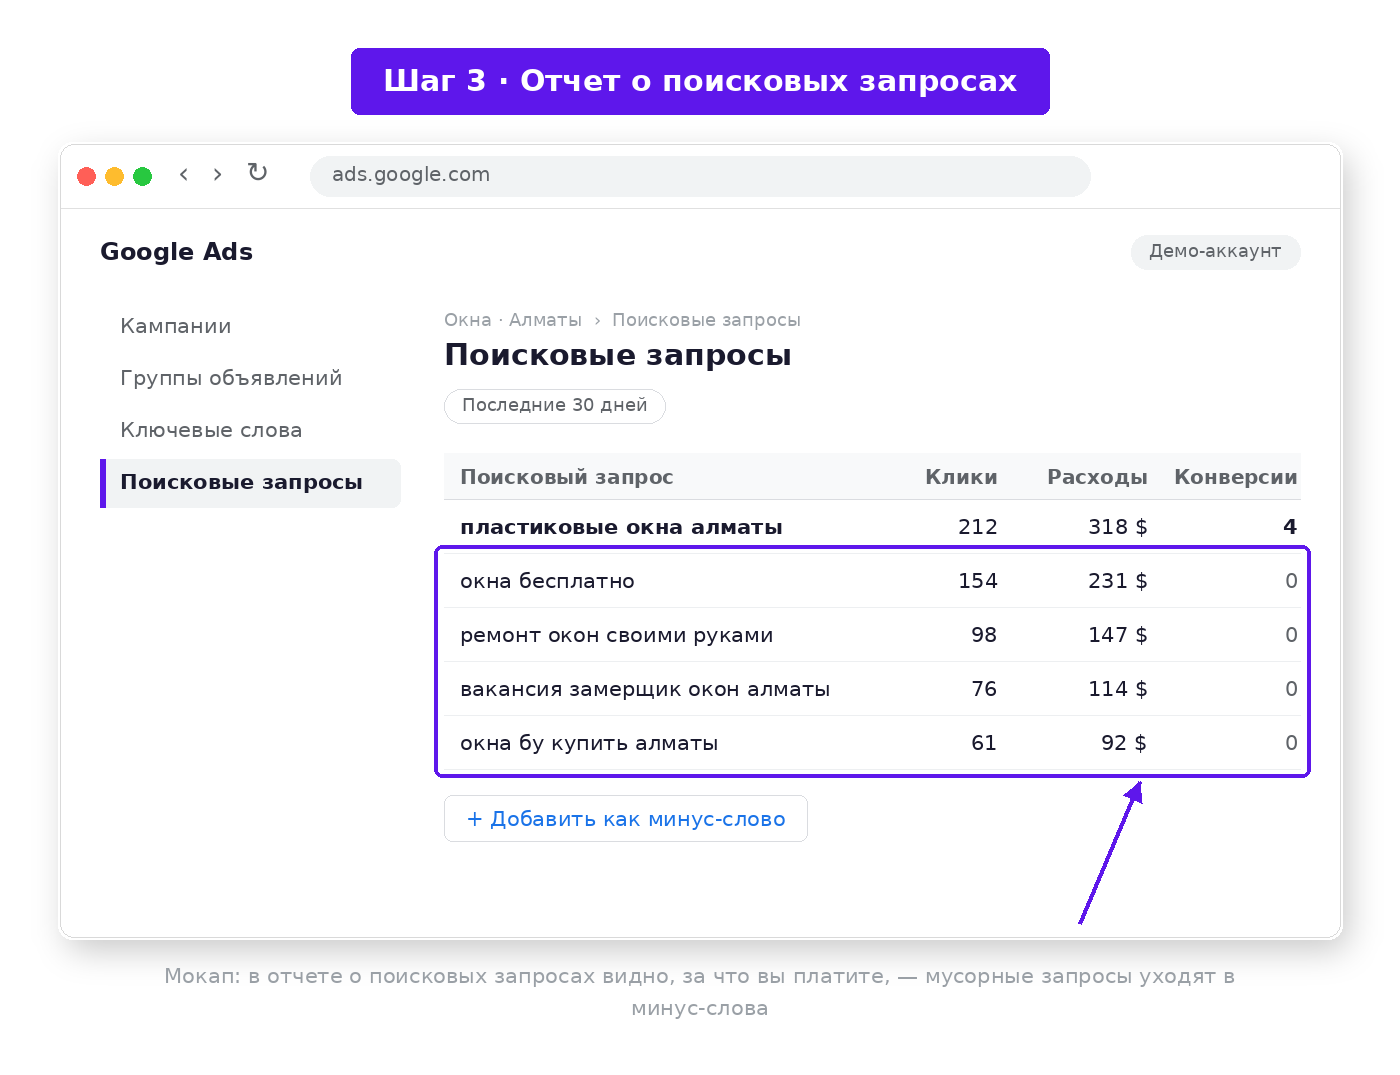
The client pays for queries like "free," "DIY," "jobs," "courses," "how to do it yourself" — queries with no buying intent. In Singapore, the agency Sotavento Medios managed a professional services account on broad match: the client paid for "free consultation" and "how to do it yourself," while there was no click-to-deal tracking at all. After rebuilding the account around intent: +250% qualified leads and -40% wasted budget in 6 months.
5-minute check: open the "Search terms report" for 30–90 days. If more than 20% of the budget goes to irrelevant queries, the problem is quality, not volume. That's the "20% rule": also check the landing page bounce rate — above 70% confirms the diagnosis.
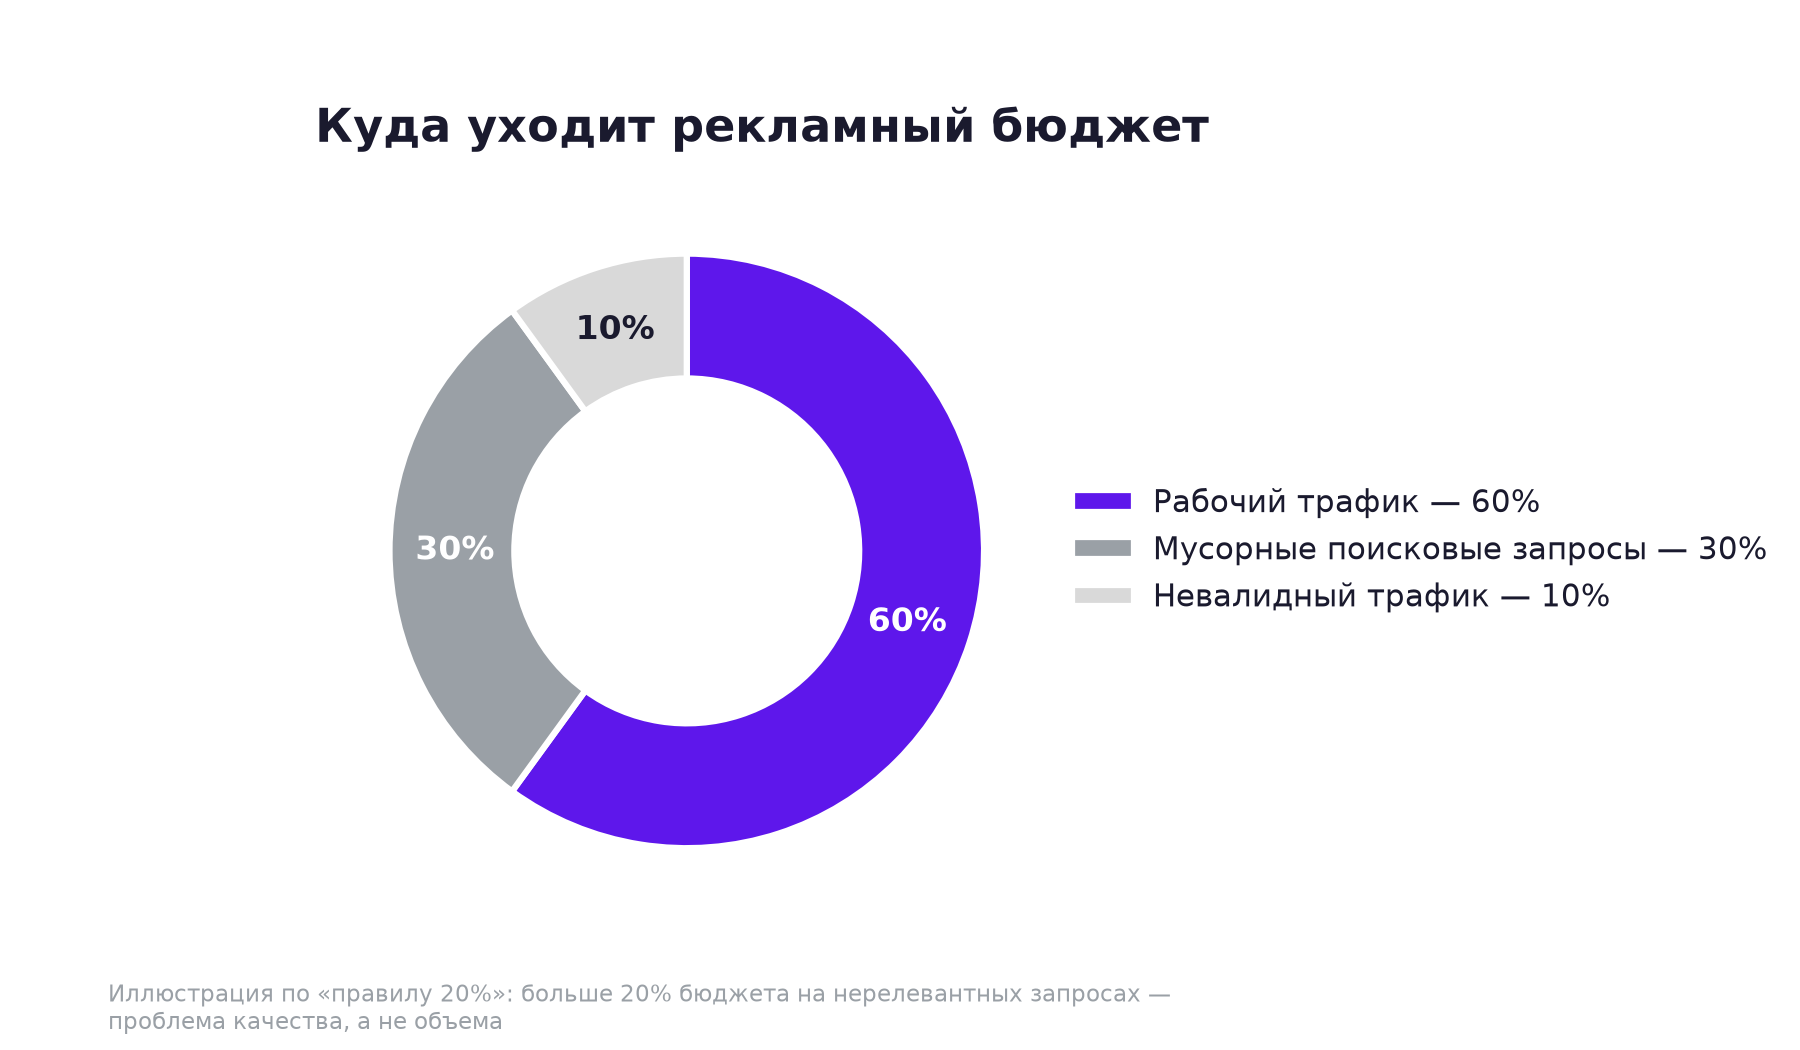
The fix: negative keywords (only after reviewing the queries, not blindly)
Going through the search terms report yourself is faster with a checklist: four checks for owners who run Google Ads themselves., tighter match types, separating intents into different campaigns.
*Loop 1.* Want to walk through this analysis on your own account step by step? The PDF "Google Ads Cheat Sheet" has Step 4 · Keywords and Search Terms — it breaks down where to look at groups, cost per conversion by keyword, CTR, and how to work with negative keywords, including exclusion lists. Write the code word ШПАРГАЛКА — and grab the cheat sheet.
2. Tracking counts garbage
The form event fires without a real submission. Tags are duplicated. Spam leads count as conversions. According to the Proven ROI agency's internal audit (130+ accounts), up to 41% of tracked leads are distorted — due to tag duplication, broken GCLID capture, and form events firing without submission.
In the Karachi IT agency case, out of 200+ monthly form submissions 40% were spam and another 25% were unqualified (students, job seekers, off-profile companies). So about 65% of the account's "conversions" weren't business leads at all. After protecting the forms, spam dropped from 80+ to fewer than 5 leads a month.
An important nuance straight from Google: filters remove invalid clicks, but fake contact details and invalid forms can reach the website and CRM. The account will show a conversion. The cash register won't.
5-minute check: compare the number of "conversions" in Google Ads with real CRM records for the same 30 days. A discrepancy over 20–30% means the tracking is lying.
The fix: repair GCLID capture (test submission in incognito — the GCLID must land in the CRM), remove tag duplicates, split events: form submission / valid lead / qualified lead / deal. Don't bid on "form submission."
*Loop 2.* In the "Cheat Sheet" this is Step 2 · Account Settings, item 17: "Goals → Conversions → Summary" — checking which conversions exist in the account and which ones the ads optimize for. If you don't know the answer to that question right now, you definitely need the cheat sheet. The code word is ШПАРГАЛКА.
3. No offline conversions: Google doesn't know who bought
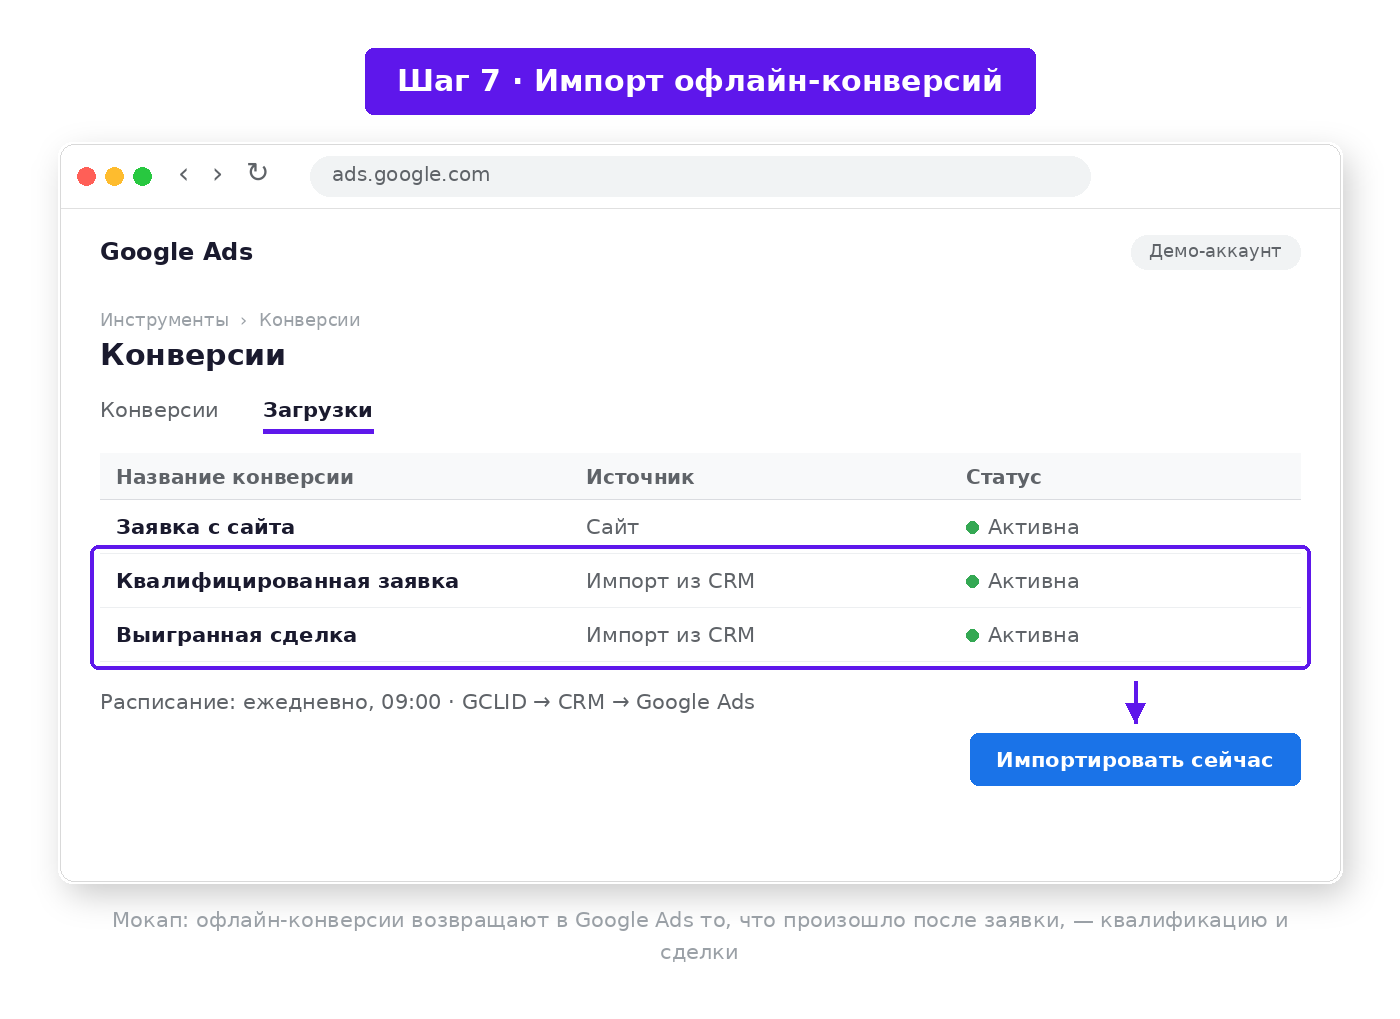
This is the central technical reason for the "empty cash register." Google doesn't know which leads bought, so it optimizes for "anyone who filled out a form." The algorithm literally learns to bring you people who fill out forms cheapest — and those are rarely the ones who pay.
Google itself describes the fix: save the GCLID after the click → pass it with the form to the CRM → send the qualification and deal facts back to Google Ads. Do the transfer regularly, ideally daily. Google officially distinguishes two types: qualified lead (confirmed in the CRM) and converted lead (a closed stage, usually a deal).
5-minute check: "Goals → Conversions → Summary." Are there conversions with the source "CRM import"? No — then the algorithm is blind.
The fix: GCLID capture in the form → storage in the CRM → import of statuses (MQL / SQL / deal / revenue) back into Google Ads → switching Smart Bidding to the new signal. Import path: native CRM integration, Zapier, or API — pick one in a single day (that's day 6 of the checklist below).
4. Bidding for volume, not value
"Maximize Conversions" without assigned values teaches the algorithm to find cheap leads, not solvent ones. A Detroit home-goods retail chain (6 stores, ~$50M revenue) saw $16 leads from Performance Max — but marketing couldn't say which leads became sales. About $10,000 a month was spent with no proof of payback.
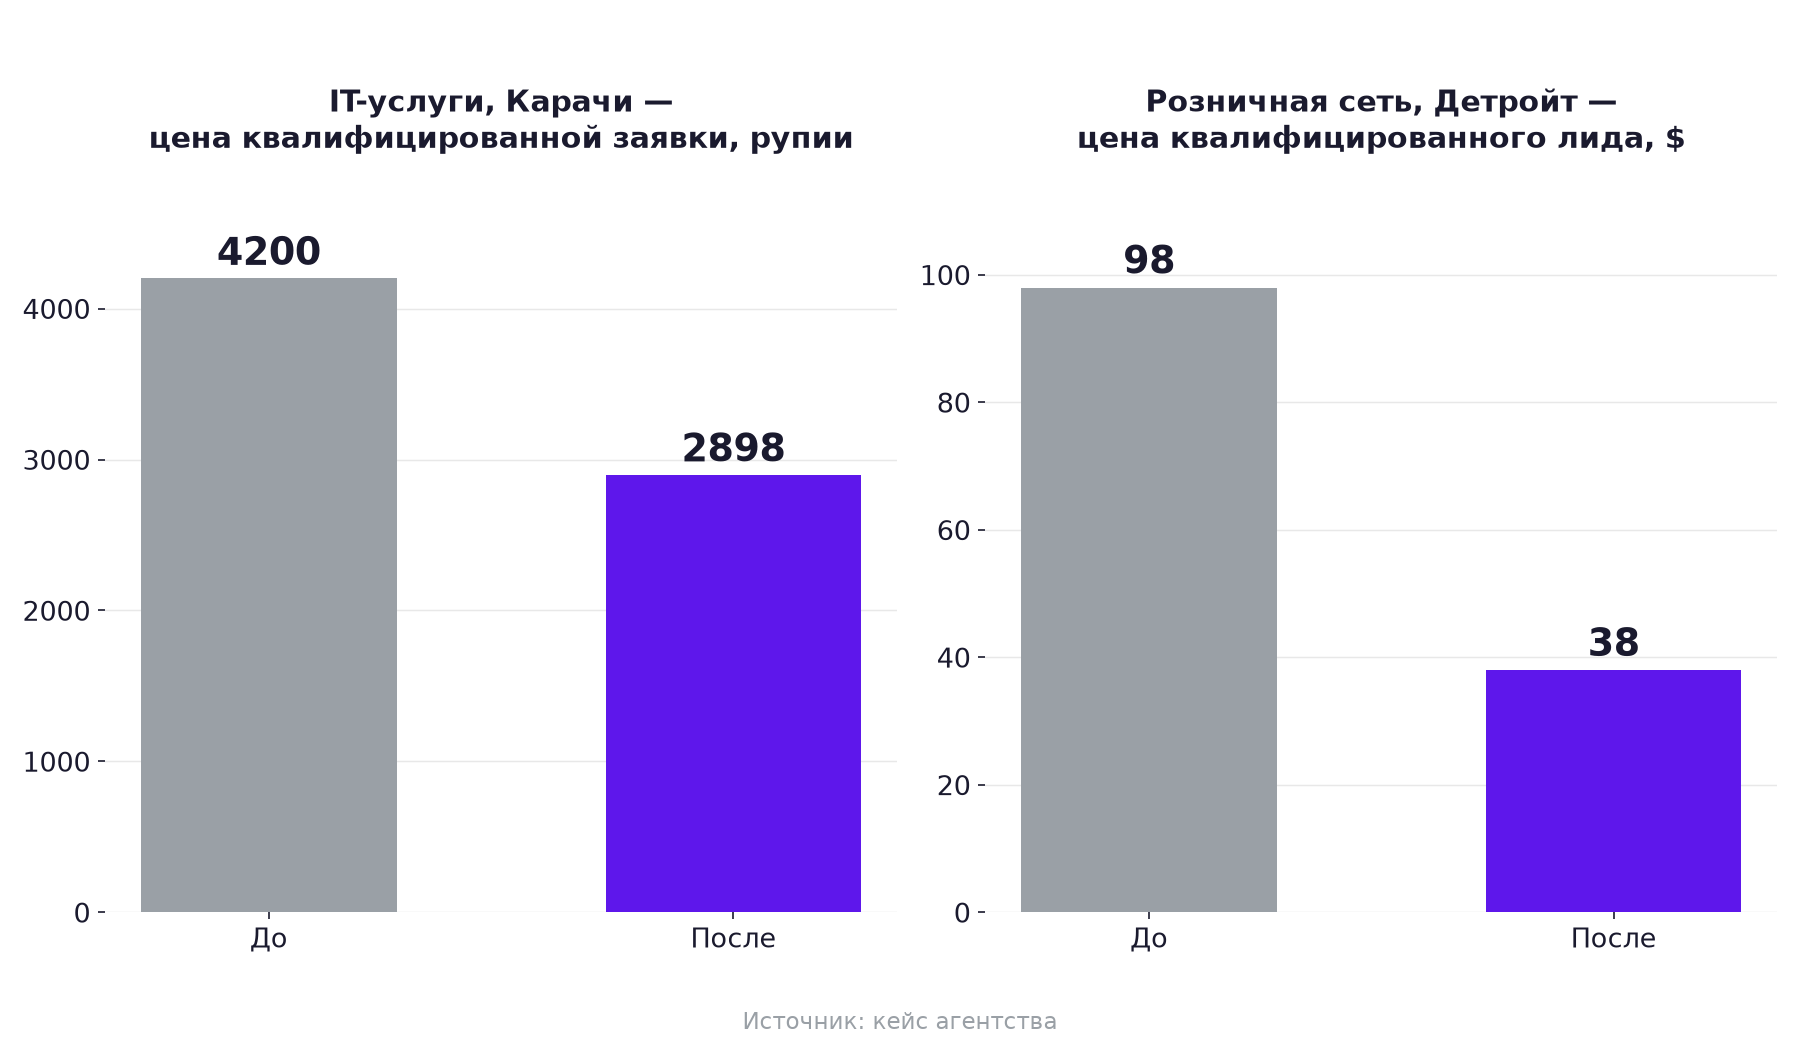
The fix: call tracking, staff started rating calls (worth a quote / not worth it), and only quality leads were passed to Google Ads in real time. Result over 4 months: qualified leads x3.5 (+250%), cost per qualified lead $98 → $38 (-61%), spend -8%, and register sales +12% year over year — against -10% at competitors.
5-minute check: open the bid strategy. If it says "Maximize Conversions" and no conversion has a value assigned — you're in this section.
The fix: value-based bidding — different values for funnel stages. Example: price-list download — $10, quote request — $500, won deal — real revenue. The algorithm will start telling "the curious" apart from "the buyer."
5. No qualification at the gate
A three-field form (name, phone, "request a callback") lets everyone through. In the financial services case, fewer than 10% of forms were qualified: people didn't meet the revenue and business-age criteria or were looking for products the company didn't have. The real cost of a qualified lead was over $1,200 — 8.6–10x the raw lead from the account.
The agency switched the primary conversion from "form submission" to qualified lead, added qualification right into the form (revenue, years in business, product), and moved bidding to qualified lead. Result: qualified share went from <10% to >40%. And the landing page conversion rate dropped from 8% to 4% — which was an improvement: the form started filtering out the wrong fit. Lead volume halved. Profit didn't.
5-minute check: open your lead form. If it has not a single qualifying question (budget, timeline, task type) — you're collecting everyone.
The fix: qualification in the form or quiz, lead scoring, a call-duration threshold for counting a call as a conversion. Yes, there will be fewer leads. That's fine — you'll see why below.
*Loop 3.* The landing page is half the qualification. In the "Cheat Sheet" this is Step 6 · Landing Pages: what to check on the landing page through the client's eyes before blaming the traffic. The code word is ШПАРГАЛКА.
6. The hole in the sales department
Part of the "empty cash register" isn't the ad account at all. Numbers worth memorizing:
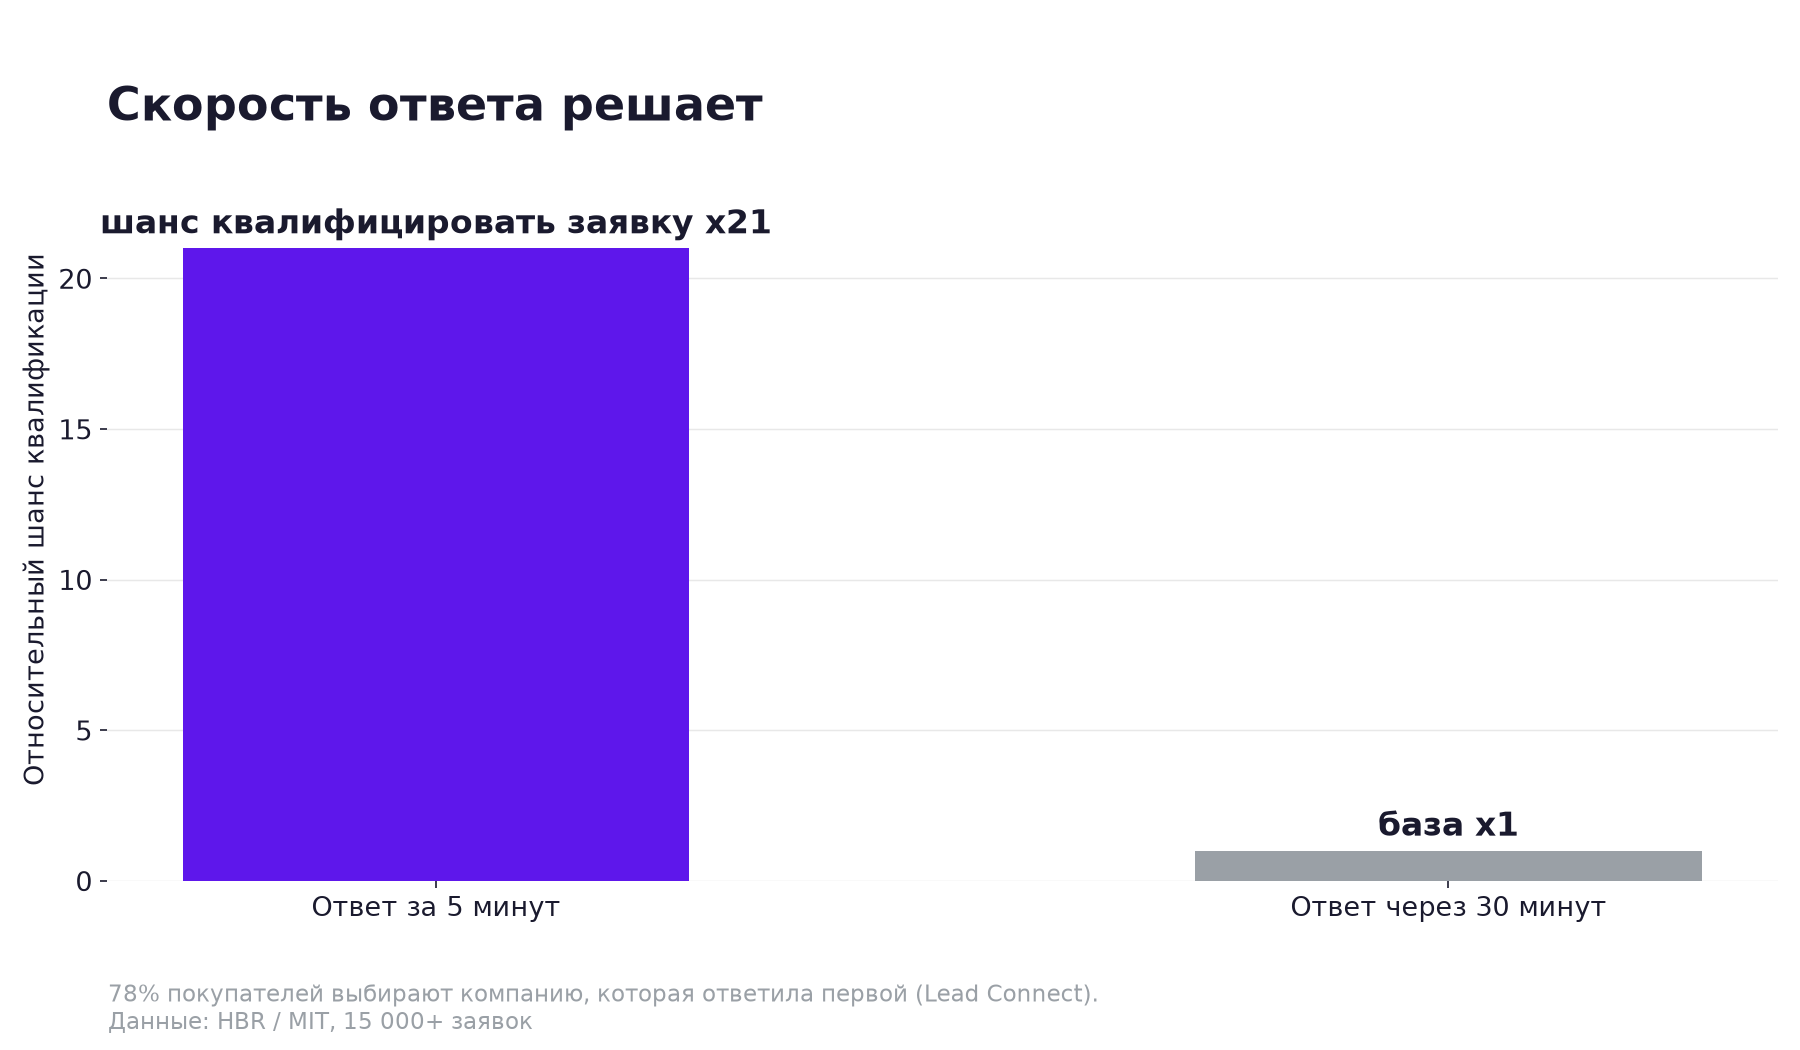
- Responding within 5 minutes gives 100x more chances to make contact and 21x more chances to qualify a lead than responding in 30 minutes (HBR / MIT, 15,000+ leads).
- 78% of buyers choose the company that responded first.
- The average company responds to a lead in 47 hours. Two days.
In the commercial kitchen equipment repair case for restaurants, about half the budget went to household queries — apartment owners asking to fix a home fridge. But that was only half the problem: calls weren't tracked at all, and ads led to the homepage instead of a commercial landing page. After splitting demand, adding call tracking, and a weekly query review: commercial lead share 30% → 72%, cost per qualified lead -48%, unqualified spend -60%.
5-minute check: ask your sales team how fast they call back. If "within the day" — there's your hole.
The fix: an SLA for first contact (5 minutes during business hours), call recording, a weekly "lead → outcome" reconciliation between marketing and sales. Cut conversion by response intervals: under 5 minutes / 5–15 / 15–30 / 30–60 minutes / 1–4 hours / over 4 hours.
7. Invalid traffic and partners
Google's search partner network and dubious placements deliver cheap clicks with no buying intent. Scale estimates differ (methodologies vary), so I'll give a range rather than an exact number:
- ClickPatrol (2025): 1 in 6 PPC clicks is fraudulent; advertiser losses — $84 billion a year.
- Fraudlogix (105.7 billion impressions in 2025): global invalid traffic share — 20.64%.
- Spider AF (H1 2026, 4 billion clicks): fraud share 5.58%, losses $25.3 billion in half a year; roughly $1 of every $18 in digital advertising goes to fraudsters.
5-minute check: in reports, add the "Network" segment — compare search vs. partner conversions. In billing, look at the invalid click share.
The fix: turn off weak partner placements, reCAPTCHA and honeypot on forms, server-side validation, investigating click spikes (IP, user agent, repeated phones and emails).
Summary table: seven gaps
| # | Symptom | Cause | 5-minute check | Fix |
|---|---|---|---|---|
| 1 | Cheap leads, zero deals | Broad match: paying for "free" and "DIY" | Search terms report: >20% of budget on junk | Negative keywords, tighter match |
| 2 | More conversions in the account than CRM records | Tracking counts spam and duplicates; up to 41% distorted | "Google Ads conversions vs CRM" reconciliation over 30 days | Fix GCLID, split funnel events |
| 3 | Algorithm pushes volume, quality drops | No offline conversions: Google doesn't know who bought | "Goals → Conversions": any CRM import? | GCLID → CRM → daily status import |
| 4 | Leads exist, but "the wrong ones" buy | Volume bidding without values | "Maximize Conversions" strategy with no values | Value-based bidding: values per funnel stage |
| 5 | Managers drowning in junk | Form without qualification lets everyone through | No qualifying question in the form | Quiz/scoring, call-duration threshold |
| 6 | Leads "go cold" | Sales responds in hours | Ask about first-contact speed | 5-minute SLA, call reviews, marketing reconciliation |
| 7 | Clicks exist, no leads | Invalid traffic, weak partners | "Network" segment in reports, billing | Partner cleanup, form anti-spam protection |
---
"Before → after" cases: what happens when you fix the lead-to-cash chain, not the account
California clinic: 92% of leads had no value
A fibroid treatment clinic (5,000+ procedures) saw a steady flow of cheap conversions from Performance Max in the account. A CRM reconciliation showed: 92% of leads had no real value for the business. The cause — a messy account structure, dirty traffic, and a volume-tuned strategy.
The agency paused PMax, rebuilt the structure, cleaned the traffic, and changed the strategy. Result: lead count +91%, cost per lead -39%, budget up just 17%. Note: there were more AND cheaper leads — but now they were real leads.
Local business: 200 leads at $25, only 12% booked
The account showed 200 leads a month at $25 — beautiful on paper. Reality: only 12% made it to a service booking. The pivot from volume to quality (negative keywords, offline conversions, value bidding) produced a paradoxical result: lead volume dropped 30%, but the close rate rose to 42%. Revenue doubled.
Remember this case. Fewer leads and more money is not a paradox. It's what a fixed chain looks like.
IT services: cost per qualified lead -31%, sales x1.75
In Karachi, the agency's 4 stages (tracking cleanup → campaign rebuild and negatives → landing page and scoring → bidding and scale) delivered in 90 days: cost per qualified lead from 4,200 to 2,898 rupees (-31%), lead-to-sale conversion from 12% to 21%, qualified leads per month from 85 to 142 (+67%), and sales-team time wasted on junk leads down from 60% to 22%.
B2B SaaS: the landing page created unqualified demand
The Upper Hand platform got traffic and conversions, but lead quality was the problem. The cause wasn't the traffic: the landing page talked about general value but didn't match visitor intent, and the form collected the contact before the person understood the product. A dedicated landing page for paid traffic, a clear value proposition, and the form below the content removed 57% of unqualified leads.
---
Benchmark your funnel
Before fixing, measure. Here are average stage conversions — compare your numbers:
| Funnel stage | Average | Source |
|---|---|---|
| Visitor → lead | 2.3% | SalesHive, B2B |
| Lead → MQL | 31% (for PPC — 29%) | FirstPageSage |
| MQL → SQL | 13% (healthy benchmark ~15%) | FirstPageSage / SalesHive |
| SQL → opportunity | 30–59% | SalesHive |
| Opportunity → customer | 22–30% (healthy close 6–9%) | SalesHive |
| End-to-end: lead → customer | 2.9% | Ruler Analytics |
| End-to-end: lead → customer, B2B | 3% (Clutch channel) | Belkins |
And two sobering numbers: 56% of MQLs the sales team receives don't match the ideal customer profile (Gartner). And the average conversion to qualified lead or sale across 13 industries is 5.13% (Ruler Analytics, 2026: 110M+ sessions, 5M+ conversions; range from 1.9% in travel to 7.9% in legal).
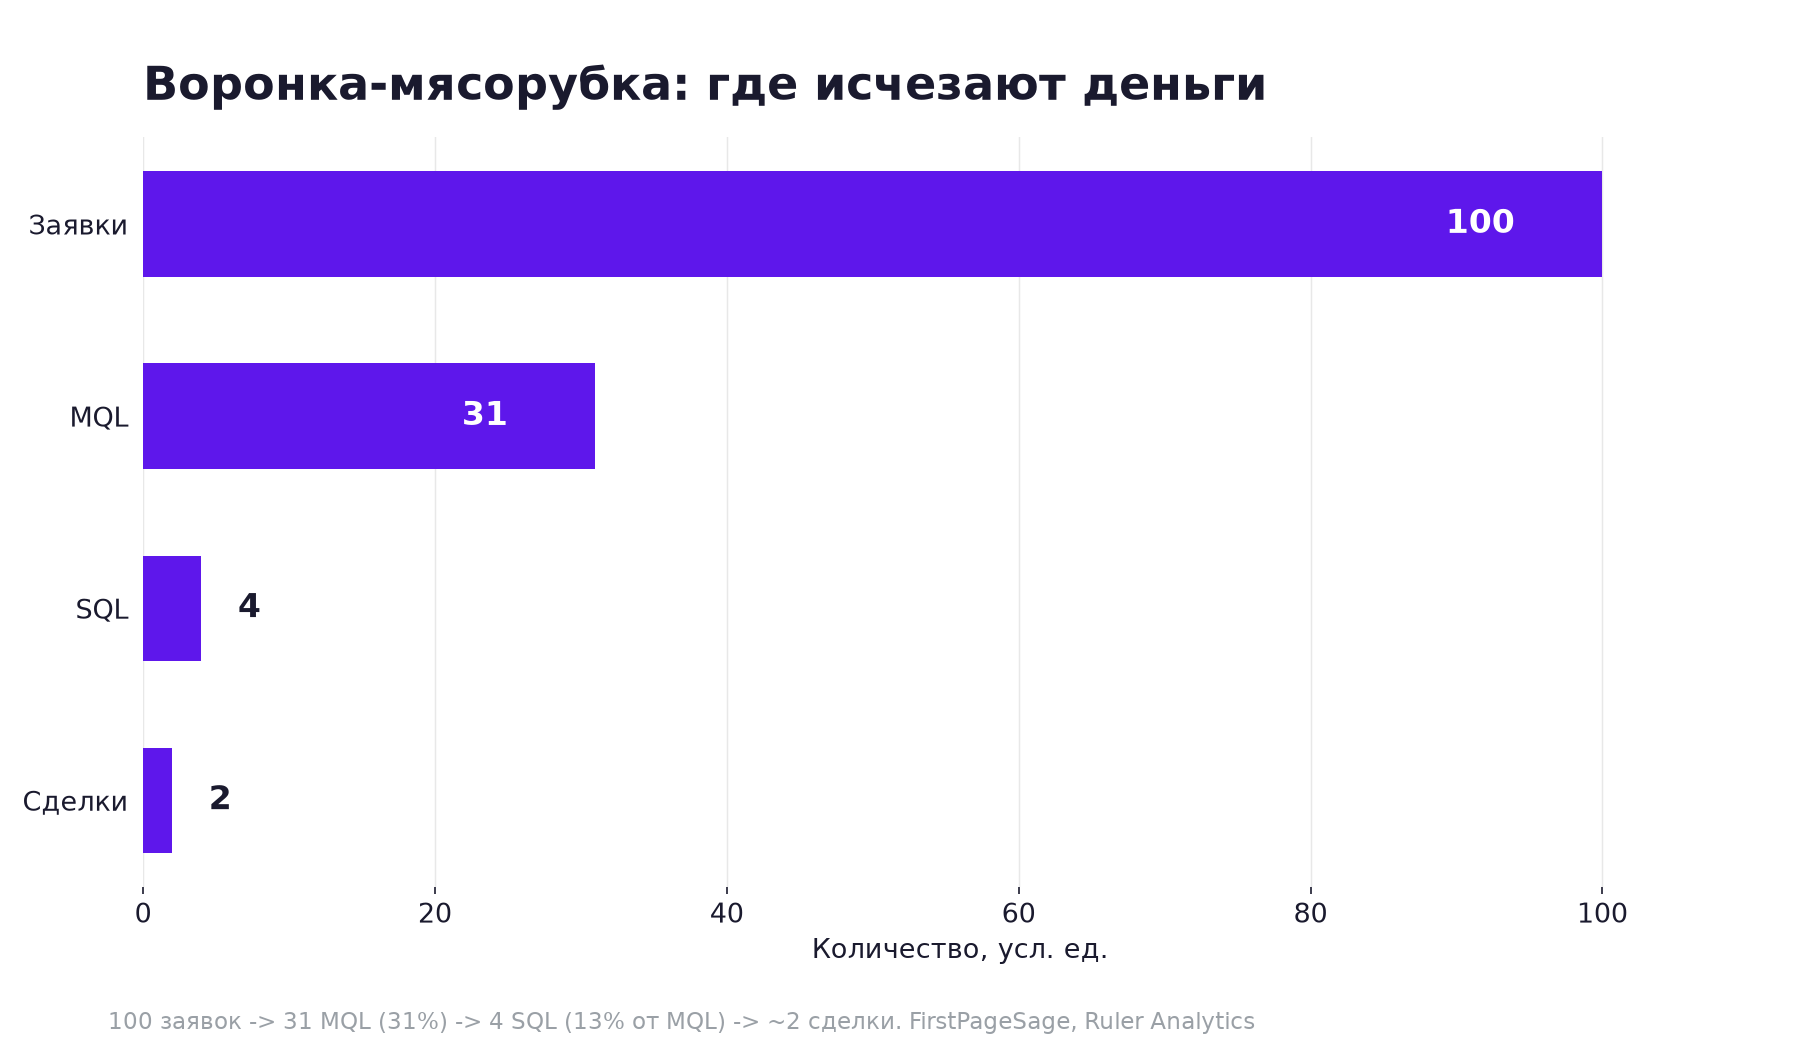
If your funnel already beats these averages — congratulations, you're in order. If it fails at some stage, you just found exactly where your "lead = money" chain breaks.
---
7-day diagnostic: the checklist
Based on an audit worth $4,000 a month in lost profit from a single tracking mistake. One hour a day — and in a week you know where your own account lies.
You can hand the data-gathering routine to AI: Manus audits your Google Ads for you — a step-by-step guide.
- Day 1. Export Google Ads conversions for 90 days: date, campaign, group, ID.
- Day 2. Match each conversion against the CRM: did it become a qualified lead, an opportunity, a deal?
- Day 3. Calculate the gap: what percentage of Google's "conversions" became customers. Under 30% — it's a tracking quality problem.
- Day 4. Check GCLID capture: a test lead in incognito mode — the GCLID must land in the CRM.
- Day 5. Define your 3 real funnel stages in writing: what a qualified lead, an opportunity, and a won deal are — the same for marketing and sales.
- Day 6. Pick your offline conversion import path: native CRM integration, Zapier, or API.
- Day 7. Launch the offline conversion flow, switch Smart Bidding to the new signal, set a reminder for 6 weeks to reconcile.
---
What to do next: a four-step plan
The diagnostic showed the holes — now the systematic fix. Order matters: each next step amplifies the previous one.
Step 1. Close the "click → cash register" loop. GCLID into the form → CRM → daily import of qualified lead and converted lead into Google Ads. Without this, everything else is cosmetics: the algorithm will keep optimizing for cheap forms.
Step 2. Switch bidding to value. Assign values to funnel stages and turn on value-based bidding. The algorithm must know the difference between "downloaded the price list" and "requested a quote" — in money, not in units.
Step 3. Put qualification at the gate. Qualifying questions in the form or quiz, scoring in the CRM, a ban on leads without status (spam / unqualified / valid / MQL / SQL / opportunity / won / lost). There will be fewer leads — the qualified lead rate will grow severalfold, as in the financial services case (from <10% to >40%).
Step 4. Fix sales speed. SLA: first call within 5 minutes during business hours. Weekly marketing–sales reconciliation on the "lead → outcome" scheme with a breakdown of disqualification reasons. Remember: 78% of buyers choose whoever responded first.
Scale only what delivers an acceptable cost per deal — not cost per lead.
---
Grab the tool: a 7-step self-audit of your account
This article gave you the map: seven gaps, three lead prices, benchmarks, and a plan. But it's better to keep the map in front of you when you're inside the account.
I've put together a PDF for you — "Google Ads Cheat Sheet: a 7-step self-audit of your ad account" — a step-by-step self-check guide: account settings, campaign structure, keywords and search terms, ads, landing pages. Everything we covered in points 1, 2, and 5 is broken down there to the "where to click" level.
To get the cheat sheet, write the code word ШПАРГАЛКА in the comments under the video — and I'll send you the PDF.
---
Sources
All numbers in this article come from open sources. No invented cases.
- "Windows and doors, USA" case (ScaledOn): https://scaledon.com/home-improvement-performance-max-case-study/
- "California medical clinic" case (marketing.link): https://marketing.link/cases/increased-leads-for-a-california-medical-clinic-by-91-a-google-ads-case-study/
- "B2B services, $96 → $6,940" case (Proven ROI): https://www.provenroi.com/blog/generate-more-b2b-leads-with-google-ads-strategies
- "IT services, Karachi" case (weproms): https://weproms.com/case-studies/google-ads-lead-generation-case-study/
- "Local business, 200 leads at $25" case (Pixaura): https://www.pixaura.com/lead-quality-over-lead-volume-how-to-fix-google-ads-campaigns-that-dont-convert/
- "Professional services, Singapore" case (Sotavento Medios): https://www.sotaventomedios.com/case-study-5-efficient-google-ads-management/
- "Financial services, CPL $120" case (Groas): https://www.groas.com/post/financial-services-google-ads-lead-quality-qualified-pipeline-case-study
- "Retail chain, Detroit" case (WhatConverts): https://www.whatconverts.com/customer-stories/collideascope/
- "Commercial equipment repair" case (GilMedia): https://www.gilmedia.com/case-studies/commercial-appliance-repair-google-ads/
- "B2B SaaS, -57% unqualified leads" case (Aimers): https://aimers.io/cases/how-ppc-cro-decreased-unqualified-leads-by-57-for-upper-hand
- WordStream by LocaliQ, 2025 benchmarks (16,000+ campaigns): https://searchengineland.com/google-ads-costs-keep-rising-but-conversion-rates-improved-in-2025-477927
- WordStream by LocaliQ, 2026 benchmarks (13,474 campaigns): https://www.usecarly.com/blog/lead-generation-statistics/
- Ruler Analytics, lead-to-customer conversion 2.9%: https://agentiveaiq.com/blog/what-is-a-good-lead-qualification-rate-2025-guide
- FirstPageSage, lead-to-MQL 31%, MQL-to-SQL 13%: https://martal.ca/lead-qualification-lb/
- First Page Sage, lead-to-MQL by channel (PPC 29%): https://firstpagesage.com/reports/lead-to-mql-conversion-rate-benchmarks-by-industry-channel-fc/
- SalesHive, B2B funnel benchmarks: https://saleshive.com/blog/b2b-lead-benchmarks-digital-marketing-gen/
- Ruler Analytics, Conversion Rate Benchmarks 2026 (5.13%): https://www.ruleranalytics.com/blog/insight/conversion-rate-by-industry/
- Belkins, B2B conversions (3% end-to-end): https://belkins.io/blog/lead-generation-conversion
- Gartner, 56% of MQLs outside ICP: https://www.sci-tech-today.com/stats/lead-conversion-rate-statistics/
- HBR / MIT, response speed (x100 contact, x21 qualification): https://caseyresponse.com/blog/lead-response-time-statistics
- Lead Response Management Study, original research: https://www.leadresponsemanagement.org/lrm_study/
- Lead Connect, 78% choose whoever responded first; Drift, 47 hours average response: https://leadresponse.co/blog/speed-to-lead-statistics
- Contractor sales-response-speed case (Elshorafa): https://elshorafa.co/blog/stayforwork-uk-contractor-accommodation-google-ads-case-study
- ClickPatrol, 2025 click-fraud study: https://clickpatrol.com/ppc-click-fraud-study-2025-key-statistics-industr/
- Fraudlogix, 20.64% invalid traffic: https://www.itweb.co.za/article/sa-advertisers-lose-up-to-r12bn-a-year-to-ad-fraud/Pero3qZ36JzvQb6m
- Spider AF, H1 2026 fraud report: https://www.barchart.com/story/news/4401047/spider-af-report-reveals-25-3b-global-first-half-ad-fraud-losses
- Google Ads: qualified lead vs converted lead: https://support.google.com/google-ads/answer/11459091?hl=en-GB
- Google Ads: offline conversion import (GCLID → CRM → Google Ads): https://support.google.com/google-ads/answer/2998031?hl=en
- Salesforce-to-Google Ads offline conversion import (Search Engine Land): https://searchengineland.com/offline-conversion-import-salesforce-google-ads-395716
- Google Ads: invalid clicks and forms: https://support.google.com/google-ads/answer/11182074?hl=en
- 7-day audit checklist: https://www.sfdigital.co.uk/blog/4000-month-conversion-tracking-mistake-google-ads/
- The 20% rule and quality diagnostics: https://www.pixaura.com/lead-quality-over-lead-volume-how-to-fix-google-ads-campaigns-that-dont-convert/
- Value-based bidding, lead quality tactics: https://medium.com/@ryanhall1307/8-google-ads-management-tactics-to-improve-lead-quality-e4205531c879
- Qualification and scoring: https://expertbeacon.com/google-ads-lead-quality/
- 10-step diagnostic (extended): https://hackmd.io/@westcollection14/BkloLz39kx
---
About the author
Ievgen Kovalevskyi — a Google Ads specialist since 2009. For the last three years — artificial intelligence: he builds full multi-agent systems that replace entire departments in businesses and for experts. He runs projects in Kazakhstan, Ukraine, the USA, Canada, and Europe.
*Article prepared for the ikovalevskyi.com blog. October 2026.*